

Knowledge base › Survey guide
Survey guide
What is an echogram, and how does it show the true bottom?
An echogram is the full record of echo strength through the water column for every ping, not just the single depth value the echo sounder picks. Recording it lets you check that the right echo was taken as the bottom, edit out vegetation or noise afterwards, and, with a dual frequency transducer, see soft silt sitting on a harder bottom.
3,200 echogram samples per ping
~1,500 m/s speed of sound in water
200 + 33 kHz dual frequency channels
3,201 values recorded per ping
How does an echo sounder measure depth?
The transducer sends a short sonar pulse (a ping) and listens for the echo from the bottom. A precise clock measures the time between the ping and the returning echo. The echo sounder multiplies that time by the speed of sound in water (around 1500 m/s or 1640 ft/s) and halves it, because the ping travels down and back. The result is reported as a digital depth.
How does it know which echo is the bottom?
The ping can reflect off anything in its path: suspended sediment, debris, fish, underwater vegetation, loose silt and mud, or harder compacted bottom underneath. Low frequency pings can penetrate a long way into sediment, and a strong echo may even come from rock several feet below the sediment surface.
The “listening period” for each ping is the time needed for an echo to return from the maximum depth set by the operator. At the end of it, the echo sounder has a record of echo intensity against time (depth). It then runs a bottom detection algorithm to pick the most likely bottom echo, typically the leading edge of the first strong return, and reports that as the digital depth or depth pick.
So each ping produces two pieces of data:
- the depth pick, the digitised depth result; and
- the echogram (echo envelope), the complete intensity record used to calculate it: the raw data.
With so many possible echoes, the echo sounder won’t always pick the real bottom. Being able to view and record the echogram as well as the depth pick is an important step in survey quality control.
What about echo sounders without an echogram?
Basic “black box” echo sounders only output the digital depth. They are limited to straightforward survey areas where prior knowledge says the depth can be trusted. There is always a risk the digital output is wrong, and the surveyor has no way to check it without a separate ground truth method.
What’s recorded in a digital echogram?
Survey echo sounders used to print the echogram on a paper chart, which could be watched in real time and kept as a permanent QC record. Paper charts are still used, but modern echo sounders record a digital echogram.
The echo intensity is split into fixed time slices over the whole active depth range: 3,200 per ping in the CEESCOPE™ and CEE ECHO™. Each slice gets a value, so there are really 3,201 numbers recorded per ping: the depth pick plus the 3,200 measurements used to calculate it.
- During the survey, software displays the trace in real time, so you can adjust the echo sounder to keep tracking the bottom you want.
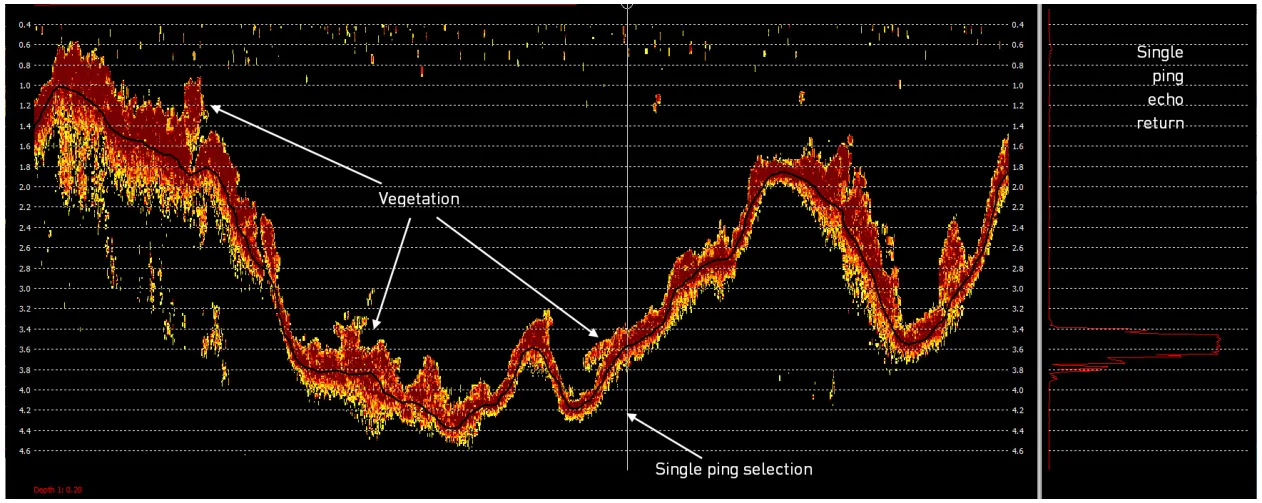
- After the survey, the echogram is used to post-process soundings, for example removing the effect of vegetation or spurious signals (Figure 1).
- It is also a permanent record of the survey.
How does dual frequency find the true bottom?
The CEESCOPE™ and CEE ECHO™ can run single channel 200 kHz, or dual channel 33 kHz and 200 kHz with a dual frequency transducer. Where the bottom may be poorly defined, especially during active dredging, dual frequency is mandatory.
- Low frequency sonar (typically 24–33 kHz) penetrates further through water and sediment, so it can find the bottom through thick layers of suspended and loosely deposited material.
- High frequency (200 kHz) tracks the upper, soft surface. If resuspended material is very concentrated, a 200 kHz echo sounder is useless: the sonar is fully absorbed before it reaches the real bottom.
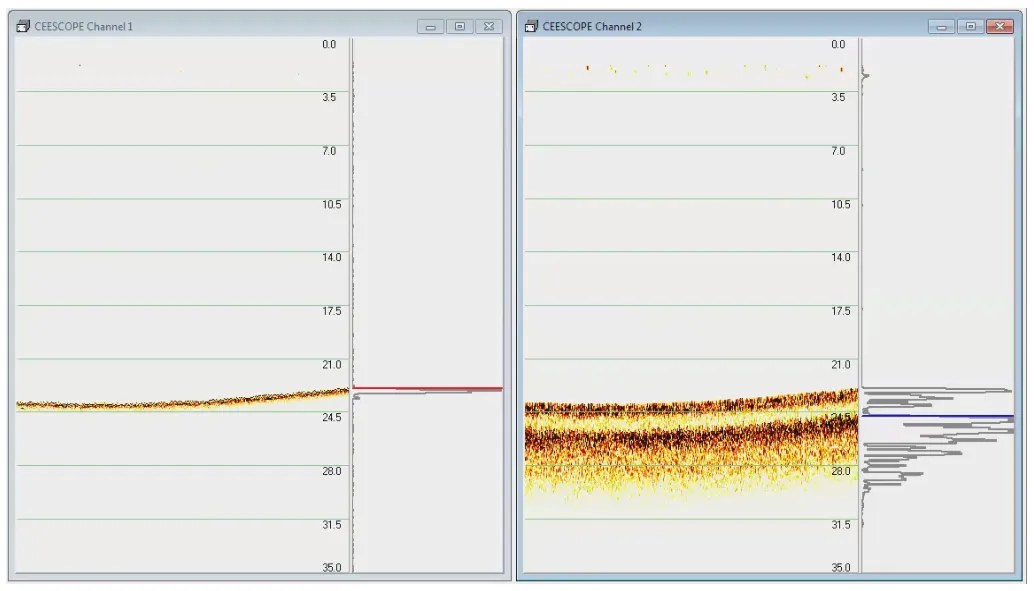
For example, during dredging the high frequency may report the soft surface of resettled material while the low frequency reports undisturbed, compacted sediment below. Combining dual frequency with the real-time echogram helps the surveyor understand the bottom and choose the right soundings to report.
Example: an industrial settling pond
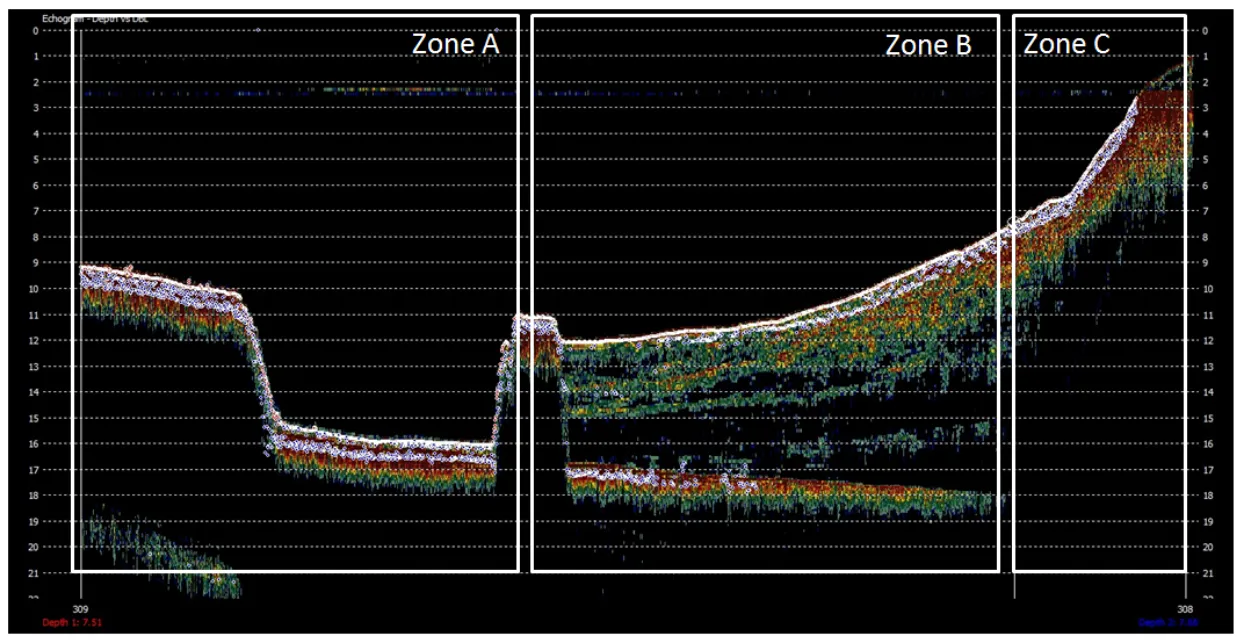
Figure 3 is a CEESCOPE™ echogram from an industrial settling pond, viewed in HYPACK®, with both channels overlaid. The horizontal axis covers about 400 m (1310 ft).
| Zone | What the echogram shows |
|---|---|
| A | The pond liner with a thin layer of deposits: essentially an empty cell. |
| B | After the berm, active deposition begins. The liner continues beneath an increasing thickness of very loose deposits. 200 kHz tracks the top of the deposits throughout; the low frequency reaches the liner 10 m (33 ft) down. |
| C | The sediment is more compacted and holds less water, so the 33 kHz no longer reaches the liner, 20 m (66 ft) below the surface. |
A qualitative tool, not a sub-bottom profiler. The CEESCOPE™ is designed to report depth, not detailed sub-bottom layers; that needs a powerful sub-bottom profiler. It does work well where you need to find relatively limited sludge build-up, for example in waste water or industrial settling lagoons.
Watching the echogram in real time lets you adjust settings to track the surface you want, and keeps post-processing to a minimum.
Equipment used
Talk to US
Need a hand with your set-up?
Our engineers answer survey questions every day.