

Case histories › Case history
Case history
Mapping eelgrass extent and height with the CEESCOPE™ and CEE ECHO™
In a San Diego Bay eelgrass survey, the CEESCOPE™ and CEE ECHO™ full water column echogram and HYPACK® editing mapped both vegetation extent and plant height on a 5 m x 5 m grid. Subtracting the digitized “real” bottom from the vegetation-top surface gives the height of the plants.
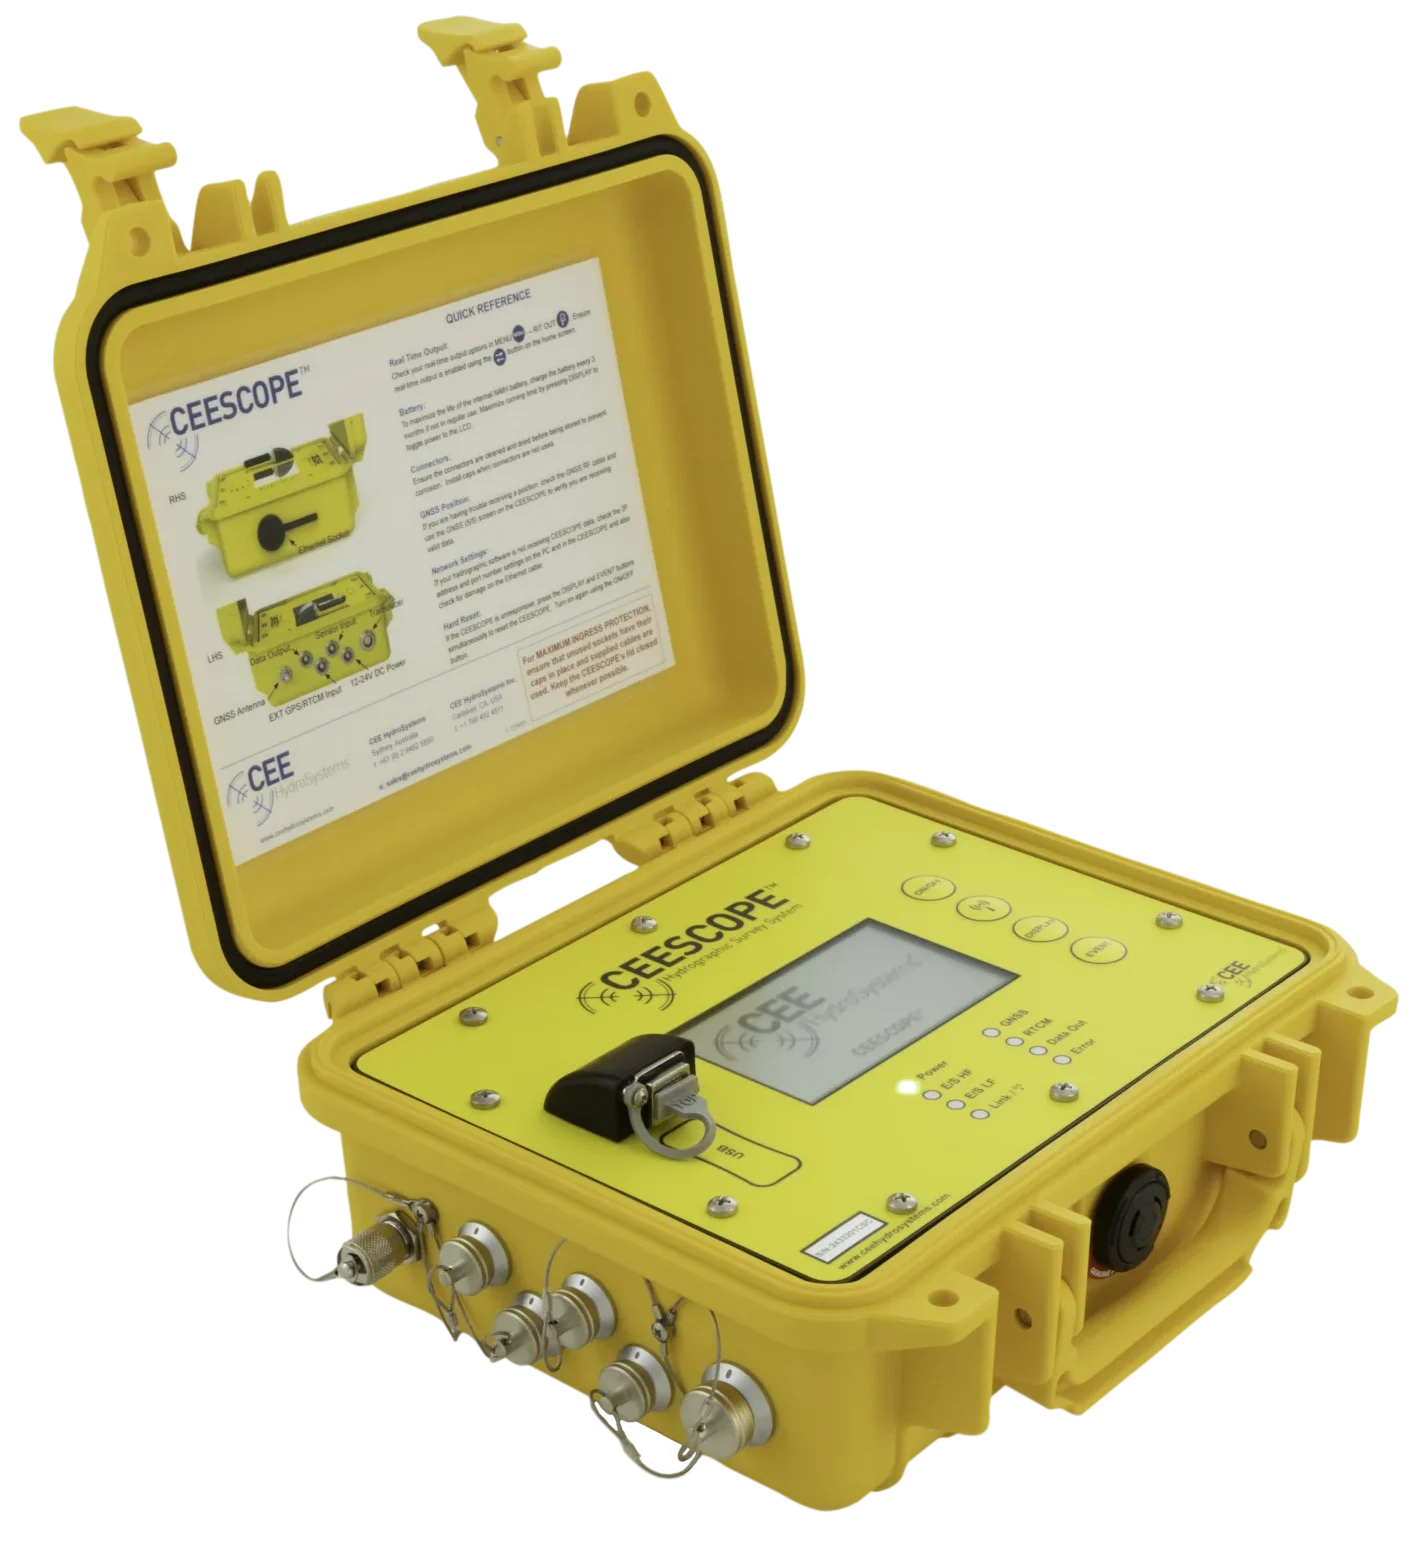
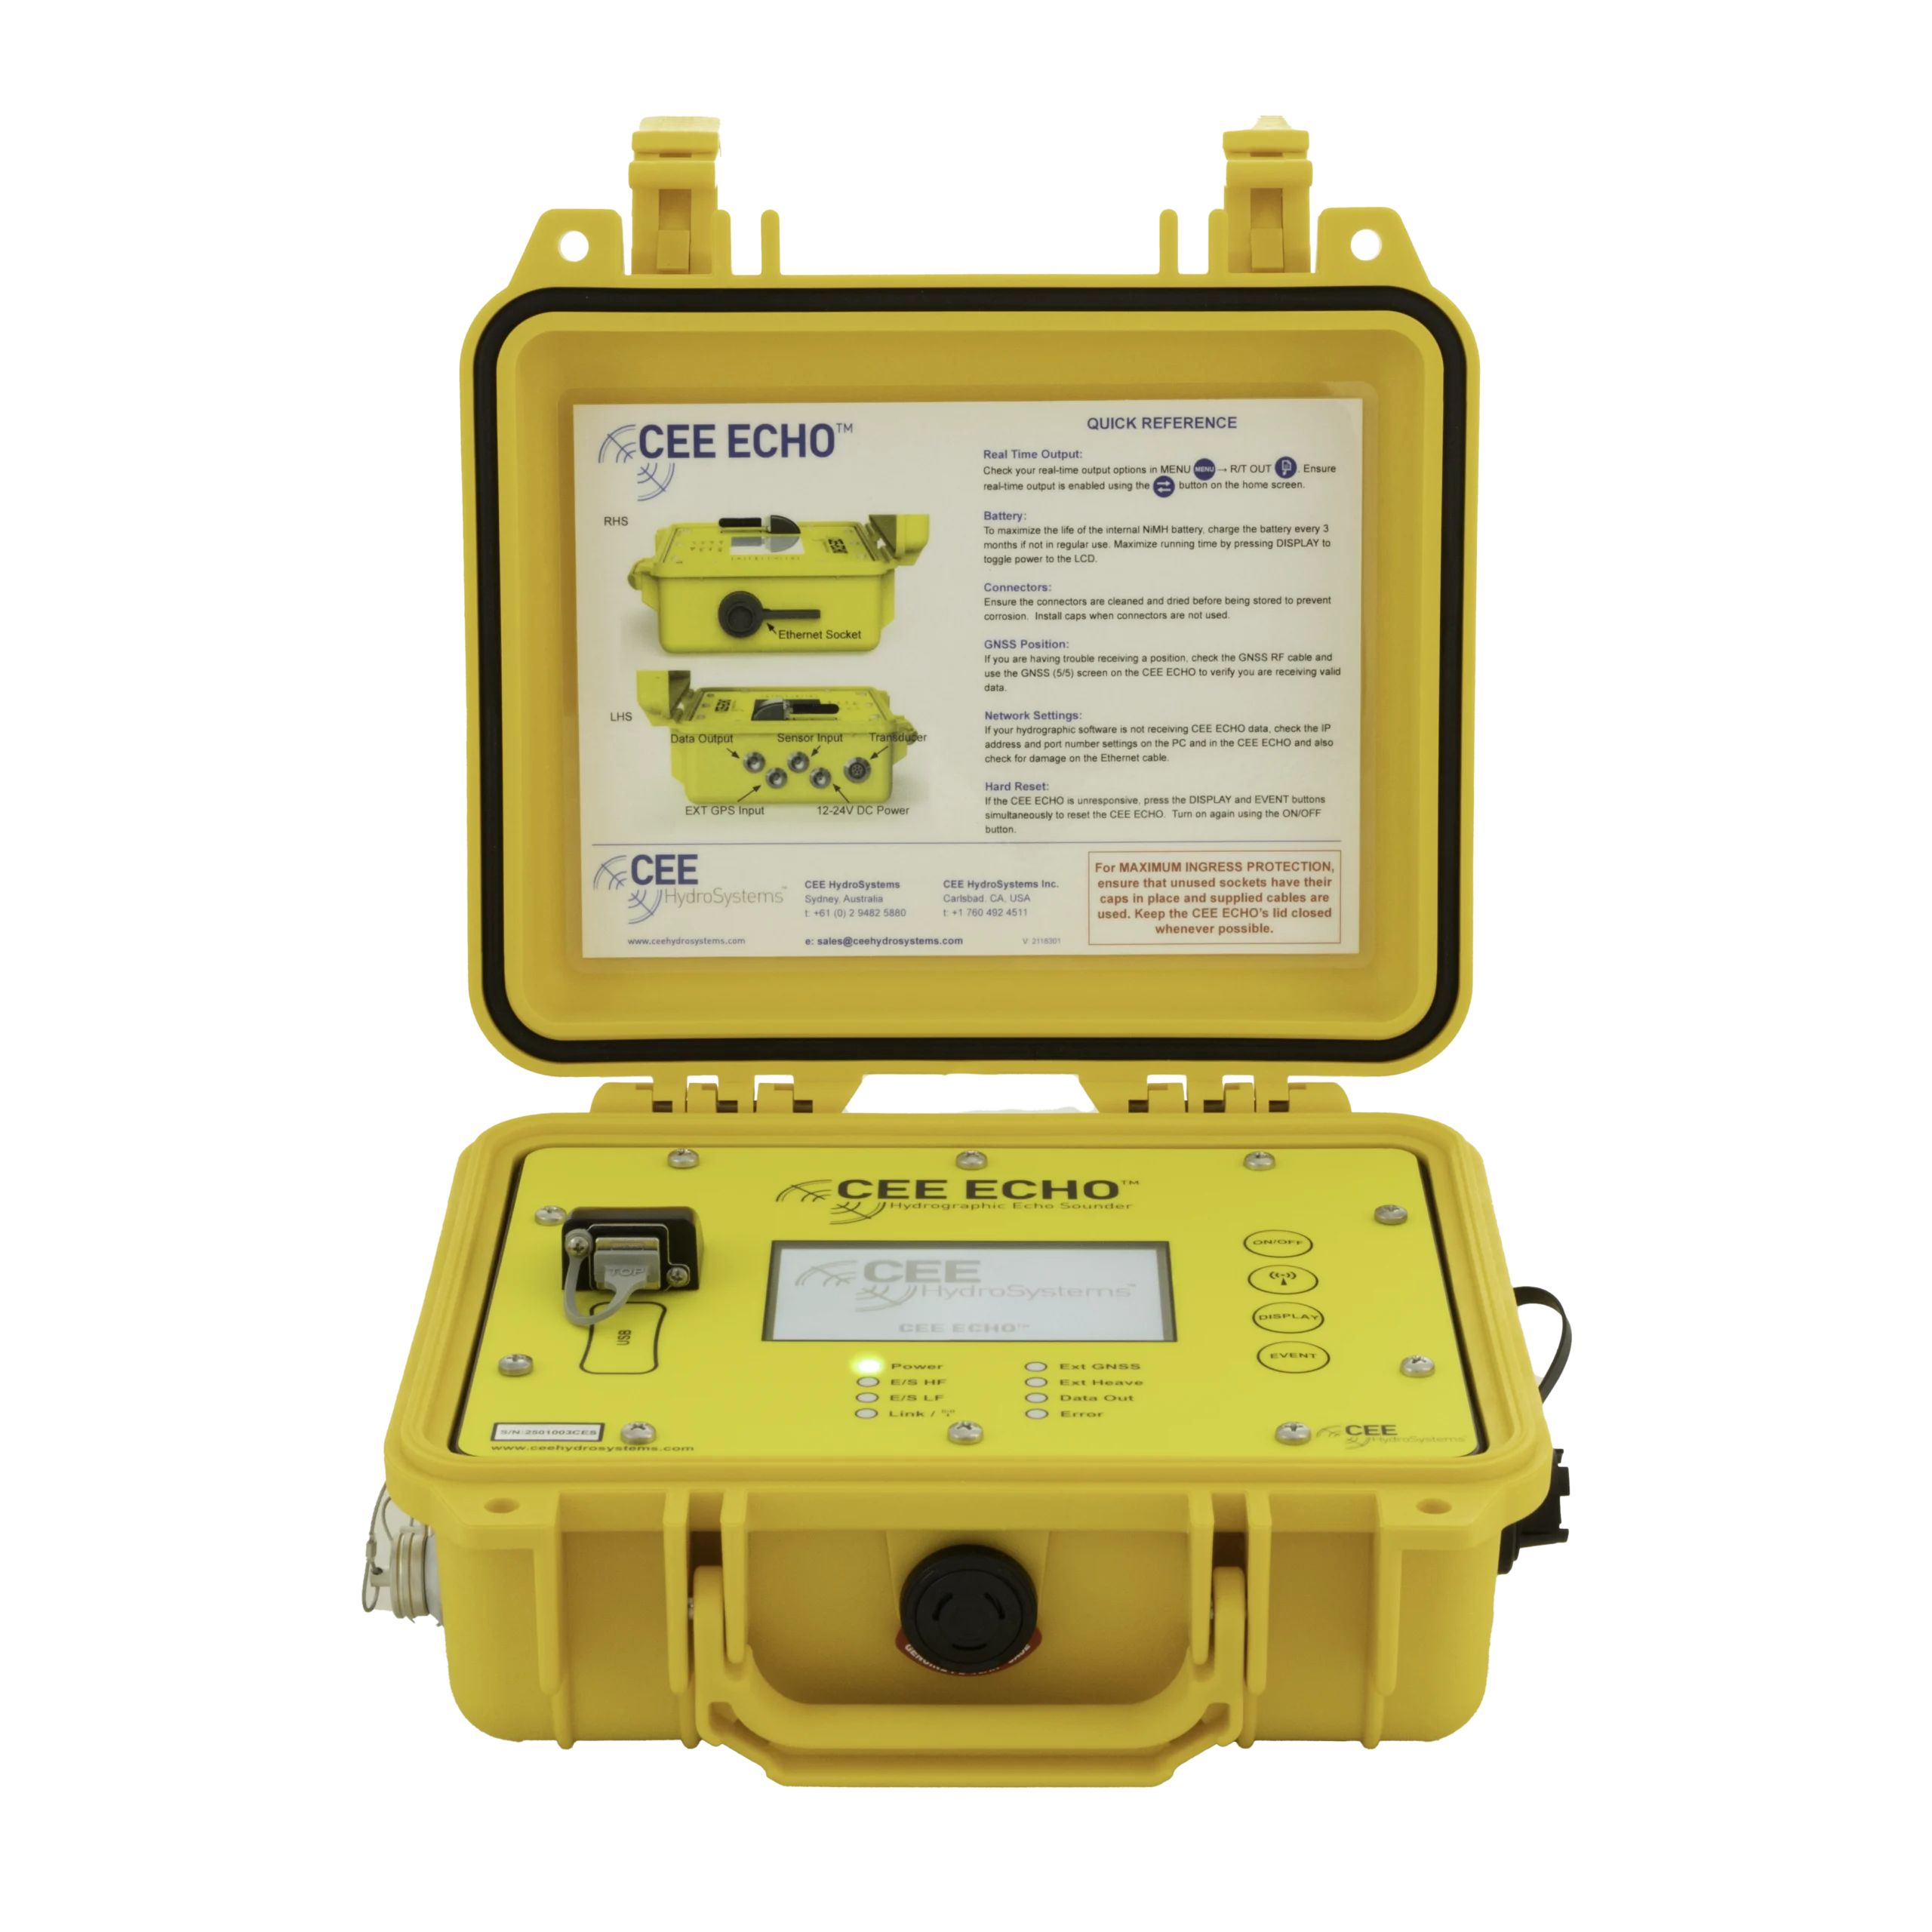
At a glance
- Location
- San Diego Bay, USA (a well-known eelgrass habitat)
- Application
- Mapping sub aquatic vegetation (SAV) coverage and plant height
- Equipment
- CEESCOPE™ or CEE ECHO™ single beam echo sounder with GPS
- Software
- HYPACK® (Single Beam Editor, SBMax)
- Survey area
- 370 x 275 m (1200 x 900 ft)
- Line spacing
- About 15 m
How the CEE ECHO™ and CEESCOPE™ single beam echo sounders can accurately map sub aquatic vegetation coverage and plant height, demonstrated by an eelgrass survey conducted in San Diego Bay, a well-known eelgrass habitat.
The problem with vegetation
The data output of the CEESCOPE™ and CEE ECHO™ single beam echo sounders includes digitized soundings and a full water column echo envelope at 20 Hz in addition to the boat position obtained from a GPS receiver.
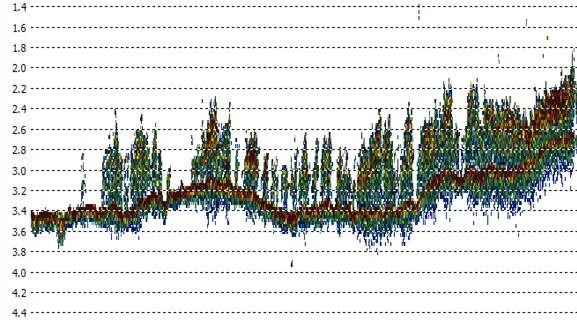
The digitized sounding data accurately tracks the bottom along the survey track. However, when sub aquatic vegetation (SAV) is present, any single beam echo sounder, including the CEE equipment, will not be able to differentiate between the “true” bottom and thick vegetation above. So, the digitized sounding data becomes unreliable.
In these circumstances, the highly detailed echo envelope output allows the surveyor to understand exactly where the vegetation is present and adjust soundings accordingly, so the survey accuracy is preserved. This feature, lacking in basic “black box” sonars, is crucially important in a high grade single beam echo sounder to maintain accuracy in difficult survey environments.
The echogram output, coupled with high quality editing software such as HYPACK®, not only allows the editing of spurious vegetation signals from the data but it facilitates the active determination of plant height and coverage where these factors are the survey goal and not just an inconvenience. The process of SAV mapping is described here.
Setting up the echo sounder
The echo sounder is first set up with a low detection threshold; in this case the built-in bottom tracking algorithm will be very sensitive in detecting the first sonar energy return, coincident with the top of any vegetation.
Usually, the AUTO bottom tracking mode will work best for the CEESCOPE™ or CEE ECHO™; this will ensure that there is enough available sonar energy to detect the top of the vegetation and penetrate through to the “real” bottom underneath. A test survey line may be run over the vegetation to ensure both the vegetation canopy and “real” bottom is visible on the echogram. Increasing the power output of the echo sounder in MANUAL mode can boost the signal intensity over the AUTO set point if required, usually only when very tall vegetation is present in quite shallow water.

Surveying and the upper surface
The echogram is viewed in real time during the survey to ensure that vegetation is being effectively mapped over all parts of the area of interest. Survey data may be recorded on the CEESCOPE™ or CEE ECHO™ and simultaneously in HYPACK® as normal for a single beam hydrographic survey.
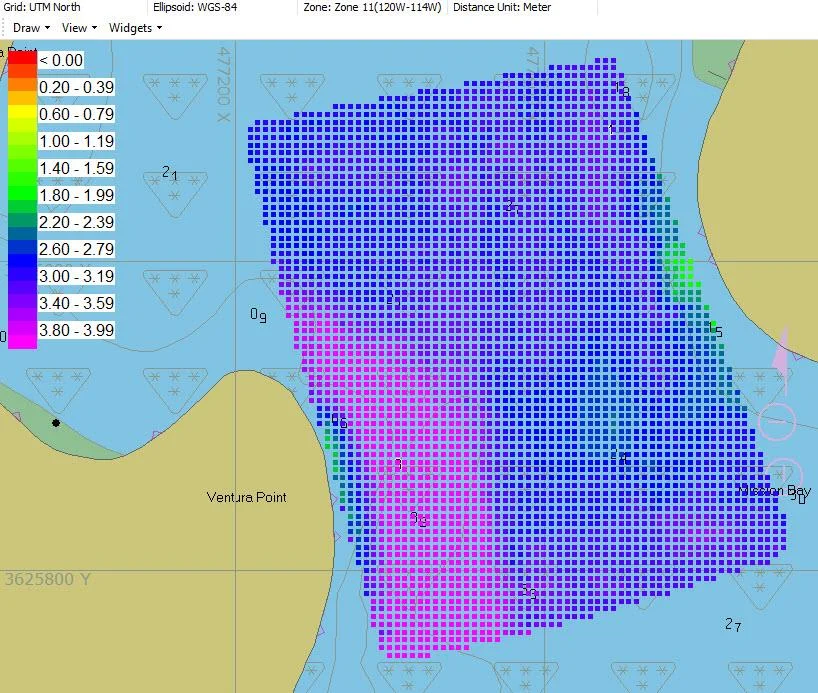
A 370 x 275 m (1200 x 900 ft) area of San Diego Bay was mapped in this manner to illustrate the process. After editing the data for minor surface water column noise, the first data output is simply the digitized soundings. These will represent the top of the vegetation and the “real” bottom where it is not obscured by the SAV above, as shown in Figure 2.
Digitizing the “real” bottom
Then, the HYPACK® digitizer tool in the Single Beam Editor (SBMax) is used to draw the “real” bottom surface for each survey line. Using Figure 1 as an example, the digitizer trace would simply follow the clearly defined “real” bottom profile at 2.8–3.6 m depth.
The data are exported exactly as for the un-modified soundings and the results are shown in Figure 3. The process is quite fast owing to the powerful editing functions available in HYPACK®. Without SAV, it’s a much cleaner picture!
Plant height and extent
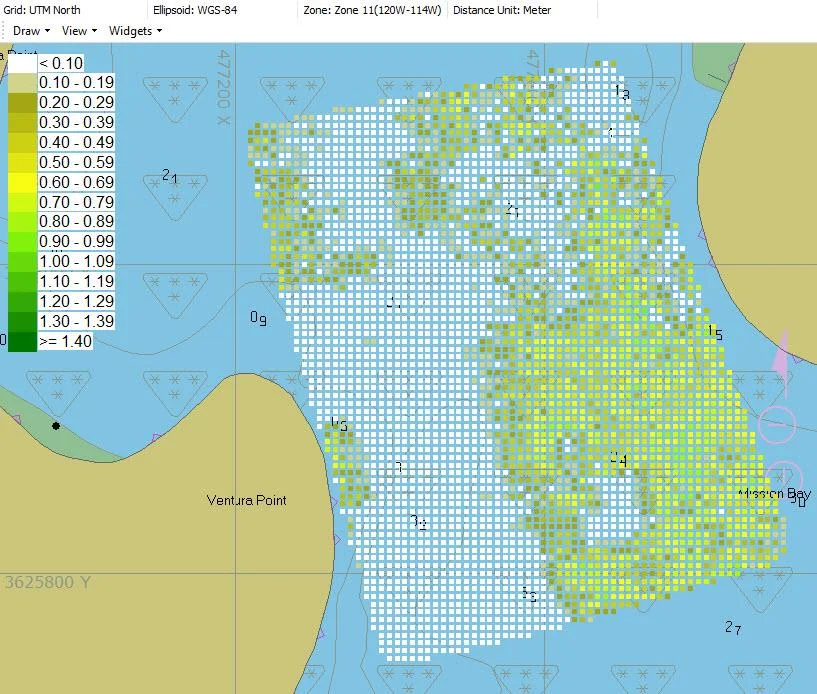
These two datasets, the re-digitized “real” bottom and the original dataset including vegetation, may now be overlaid on top of each other to compare the two sounding points. Where there is a difference there is vegetation present, and the size of the difference is the plant height. Easy!
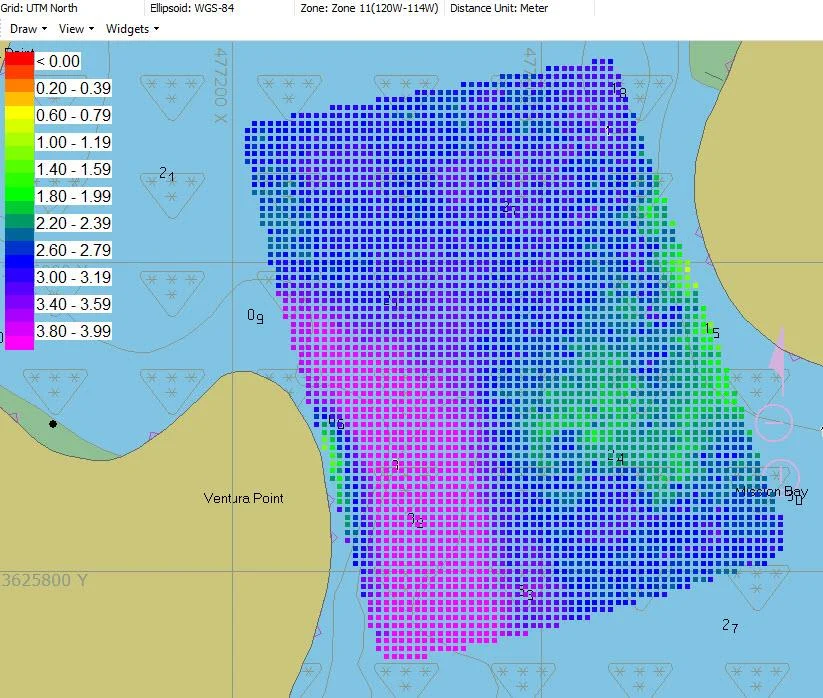
HYPACK® has a built-in tool to manage this calculation as two TIN model surfaces can be loaded, and the difference may be exported as a separate file in several formats including XYZ. Even easier! The final output is shown in Figure 4, with an eelgrass colored scale added.
By using a 5 m x 5 m grid, the survey results may be converted to a quantitative measure of vegetation extents that may be cross checked by physical inspection using underwater photographs or divers.
Line spacing and software
As the technique uses a single beam echo sounder making point measurements under the survey track, the TIN model calculation interpolates between sounding lines to fill in the entire survey area. It is up to the surveyor to determine the appropriate line spacing to obtain adequate representation of the vegetation extents for each project. For the example presented here, a line spacing of about 15 m was used.
By using HYPACK® instead of proprietary vegetation-mapping packages, the powerful traditional bathymetry survey capabilities of HYPACK® and CEE HydroSystems echo sounders are available for other routine hydrographic surveys where habitat mapping is not a focus.
Planning a similar survey?
Tell us about your site and we’ll recommend the right equipment.
Talk to us →
More from the field
6 Jan 2026
Trimble RTX for accurate wastewater sludge comparison surveys with the CEE-USV™
Team Lab monitors sludge in hundreds of wastewater lagoons with the CEE-USV™. Adding a CEESCOPE™ with Trimble CenterPoint® RTX in 2025 gave about 1 in (2.5 cm) vertical accuracy for the lagoon water level on every survey, so repeat surveys compare sludge volumes accurately without anyone going out on the water.
Team Lab monitors sludge in hundreds of wastewater lagoons with the CEE-USV™. Adding a CEESCOPE™ with Trimble CenterPoint® RTX in 2025 gave about 1 in (2.5 cm) vertical accuracy for the lagoon water level on every survey, so repeat surveys compare sludge volumes accurately without anyone going out on the water.
Read case history →
17 Sep 2023
Surveying industrial water with single beam echo sounders and USVs: mine water, frac pits and effluent ponds
How single beam echo sounders and unmanned survey boats are used for industrial water management: reservoir volume, sludge and sediment, and regulatory reporting. Worked examples cover mine tailings storage facilities, frac pits and effluent lagoon dredging.
How single beam echo sounders and unmanned survey boats are used for industrial water management: reservoir volume, sludge and sediment, and regulatory reporting. Worked examples cover mine tailings storage facilities, frac pits and effluent lagoon dredging.
Read case history →
7 Dec 2020
Surveying with the CEESCOPE™ in the coldest place on Earth
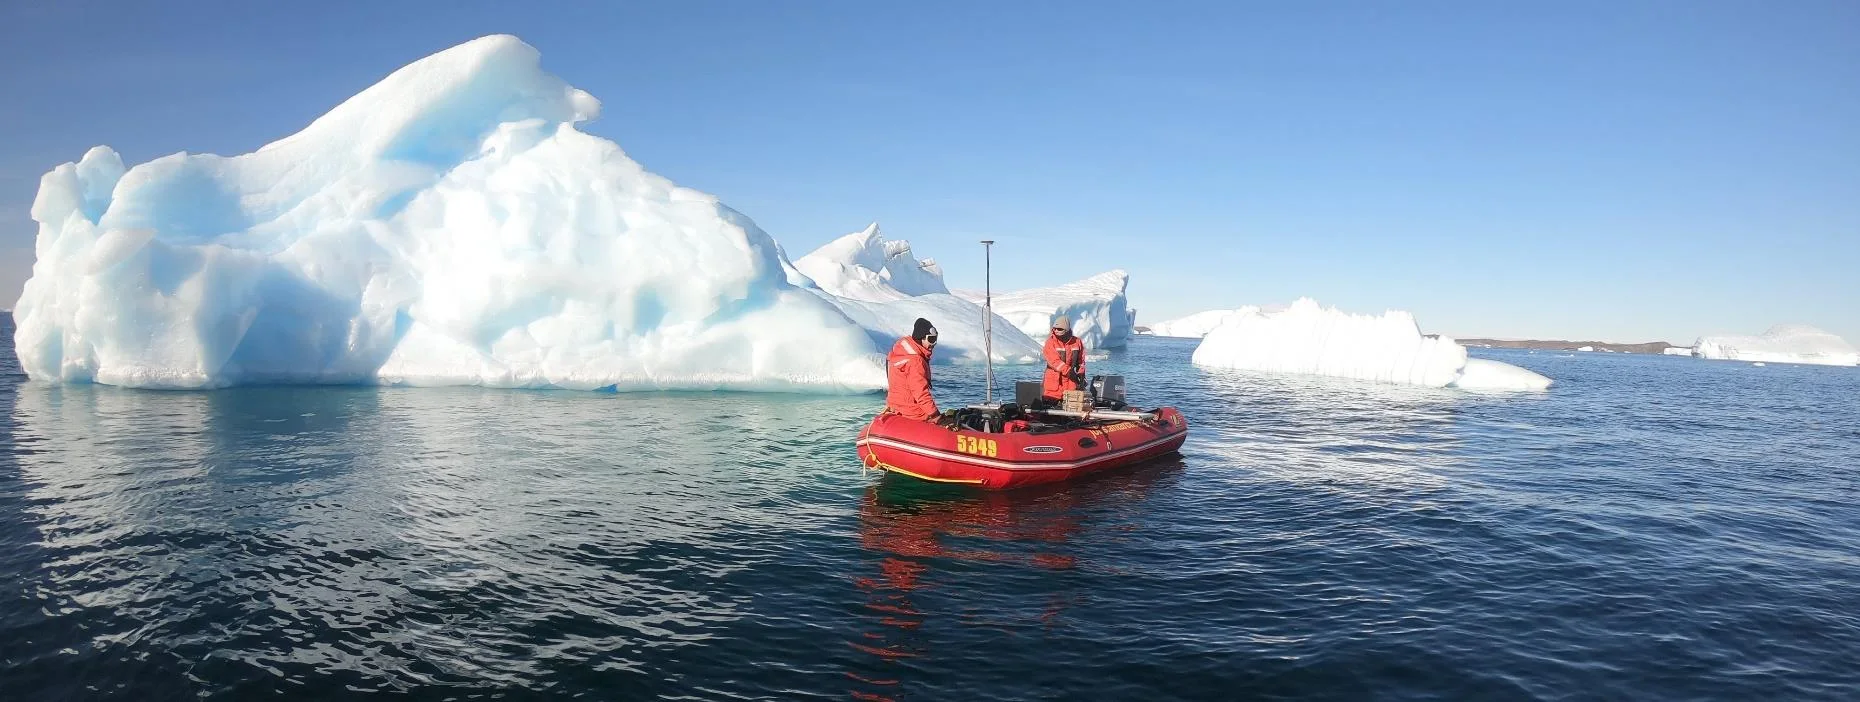
An Antarctic survey team completed bathymetry and side scan surveys around Davis Station with no mishaps or equipment problems, using a CEESCOPE™ and CEE-TSF™ StarFish side scan on a very small boat. The data helps assess a proposed concrete runway.
An Antarctic survey team completed bathymetry and side scan surveys around Davis Station with no mishaps or equipment problems, using a CEESCOPE™ and CEE-TSF™ StarFish side scan on a very small boat. The data helps assess a proposed concrete runway.
Read case history →