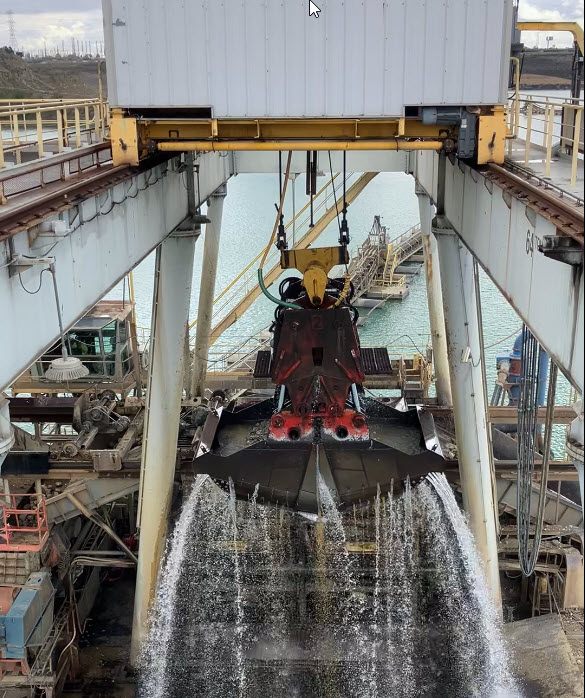
For routine monitoring of dredging activities at a historic 100-year old aggregate mine site in Irwindale, Los Angeles and other sites in the western USA region, a large mining operator invested in a CEE-USV to bring survey capability in-house. Previously, surveys were only available by contracting a local hydrographic survey company with the associated cost and logistical overhead involved with the contractor coming onto site to launch their survey boat. The aggregate mine is one of a handful still mining the high-grade materials that have been used to construct – among other things – the enormous Los Angeles freeway network.
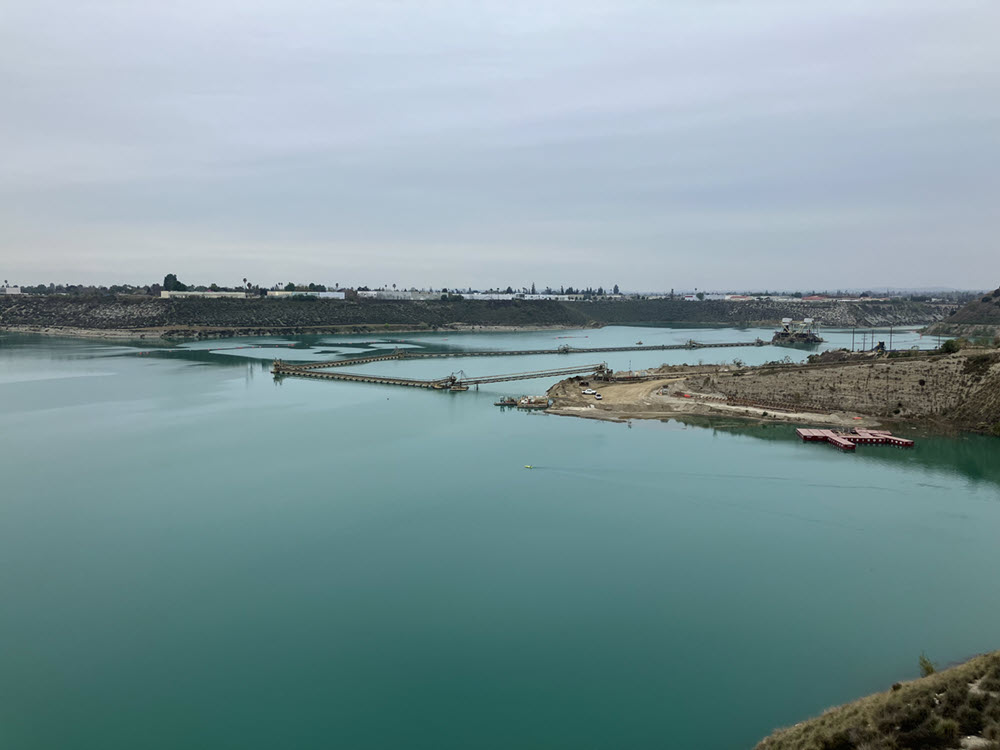
On the larger end of the aggregate mine size spectrum, the pit is about 5000ft (approx’ 1 mile) across. It is anticipated that the CEE-USV will be mostly used for specific areas of the pit to monitor ongoing dredging with the two-bucket dredge. The first survey conducted was to cover the entire pit. The CEE-USV was supplied with the autopilot navigation module to allow for robotic operation, which proves to be very beneficial for large survey areas. Owing to cables and pipes in the pit, mostly related to the dredge conveyor bringing the material on shore, the survey was split into various segments that could be loaded as autopilot route plans in Hydromagic software.
The pit is characterized by relatively flat surfaces in addition to some steep slopes up to 200ft deep. The CEESCOPE LITE survey data generated by the CEE-USV proved to be remarkably consistent. Running with the latest 2024 echo sounder bottom tracking firmware, common to all CEE HydroSystems echo sounders, the USV raw data exhibited almost no sounding points not tracking the bottom. The following statistics were determined from the survey:
Total RAW DATA soundings: 723,600
Total RAW DATA bad data points: 4 (0.0005%)
Total RAW DATA zeroes (due to surface aeration): 80
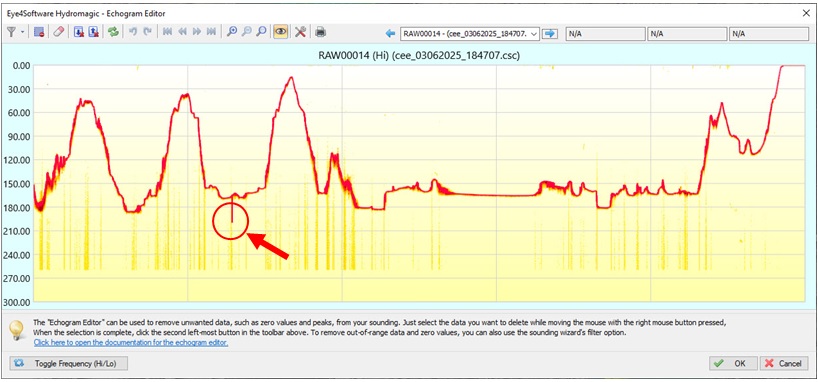
Figure 1: One of the four invalid data points collected during the two-day survey.
Hydromagic software was used to plan, execute and edit the survey. Final results are depicted as a TIN-modeled “Matrix” with calculated depth points generated within the survey area on a 3ft X-Y grid. These results may be exported for further incorporation into site datasets, for example as an XYZ point cloud.
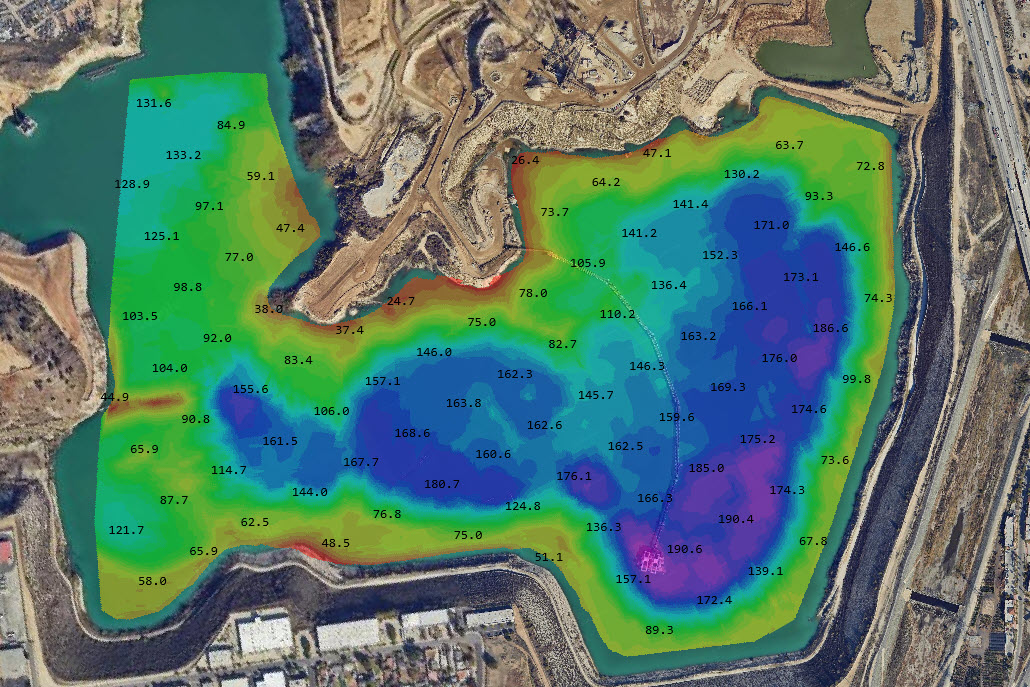
Figure 2: Final Matrix showing current state of excavations.